The goal for any company’s marketing is to make a day on the calendar become a special holiday. Two big successes are Star Wars Day (May 4th) in the US and Pepero Day (November 11th) in Korea. They became special for different reasons.
Star Wars Day works because of a sound trick. The date May the Fourth sounds like the famous phrase, “May the Force be with you.” For business, Star Wars Day is a broad sales event. Many companies give cheaper prices on any product with the Star Wars name. The day is like a Black Friday, driving sales across many different products and companies.
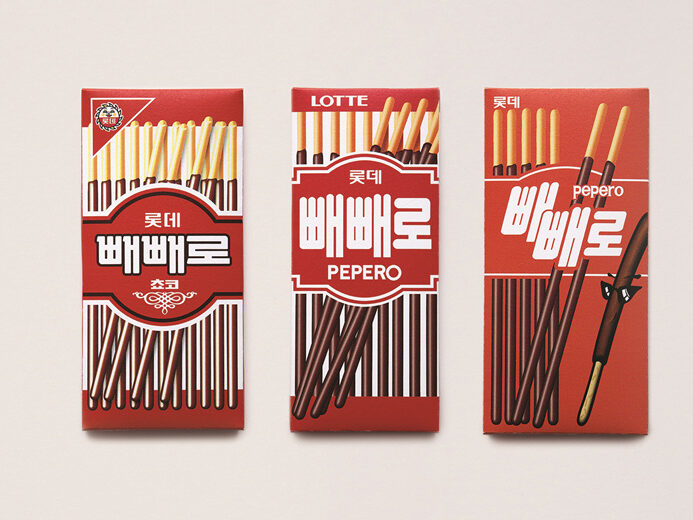
Pepero Day is different. The date 11/11 was chosen because the long, thin Pepero sticks look exactly like the number ‘1’. The whole holiday is built on this visual match.
Pepero Day is strongly connected to one company, Lotte Confectionery. The day’s goal is to make people buy and give away Pepero. It lets people show love or give a gift easily. This helps people overcome social rules and drives high sales for only Lotte.
Pepero Day is a smarter success because it targets social desires to sell its own product more, while Star Wars Day is a simpler discount celebration for many companies.
***
Reference
Zane, D. M., Reczek, R. W., & Haws, K. L. (2022). Promoting Pi Day: Consumer Response to Special Day-Themed Sales Promotions. Journal of Consumer Psychology, 32(4), 652–663. https://doi.org/10.1002/jcpy.1271
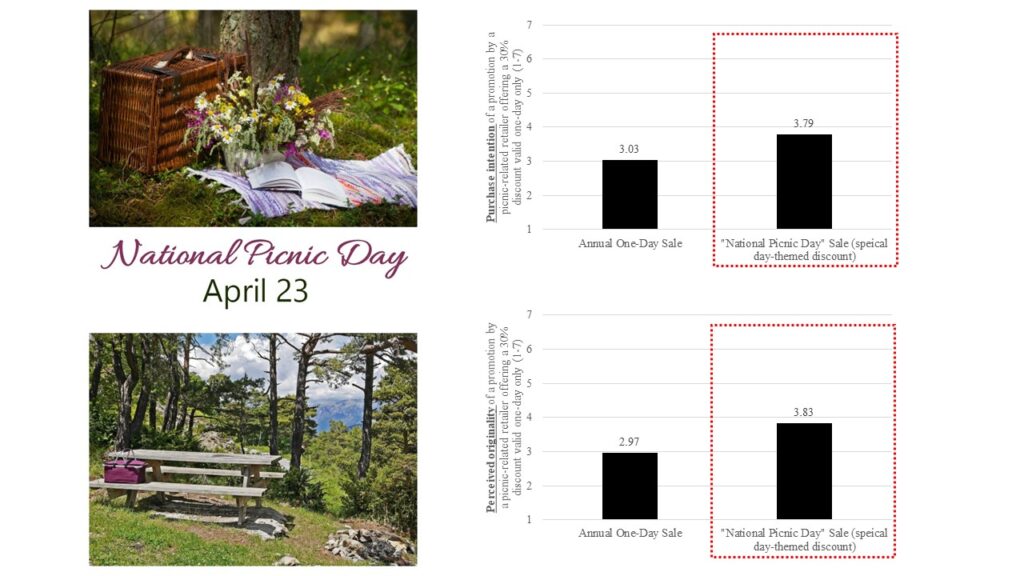
Many firms now link discounts to “special days”—novel holidays/events not historically associated with promotions (e.g., Pi Day). Using a field study and laboratory studies, we explore consumers’ responses to special day-themed sales promotions. Specifically, we demonstrate that consumers respond more favorably to a discount celebrating a special day compared to the same discount with no link to the special day. Further, we show that consumers’ increased intentions to use special day-themed discounts are driven by their perceptions of the marketer’s creativity (both the originality and appropriateness dimensions) through a marketplace metacognition process. Thus, when a given special day-themed discount becomes commonplace in the marketplace (i.e., originality is low) or when there is low fit between the firm and special day (i.e., appropriateness is low), special day-themed promotions are no more effective than more traditional types of one-day sales. Finally, we develop a typology of special day-themed sales promotions and offer avenues for future research on how consumers respond to such promotional efforts.