Tag Archives: Display

Enhancing shopper experience: A farm’s innovative fruit displays

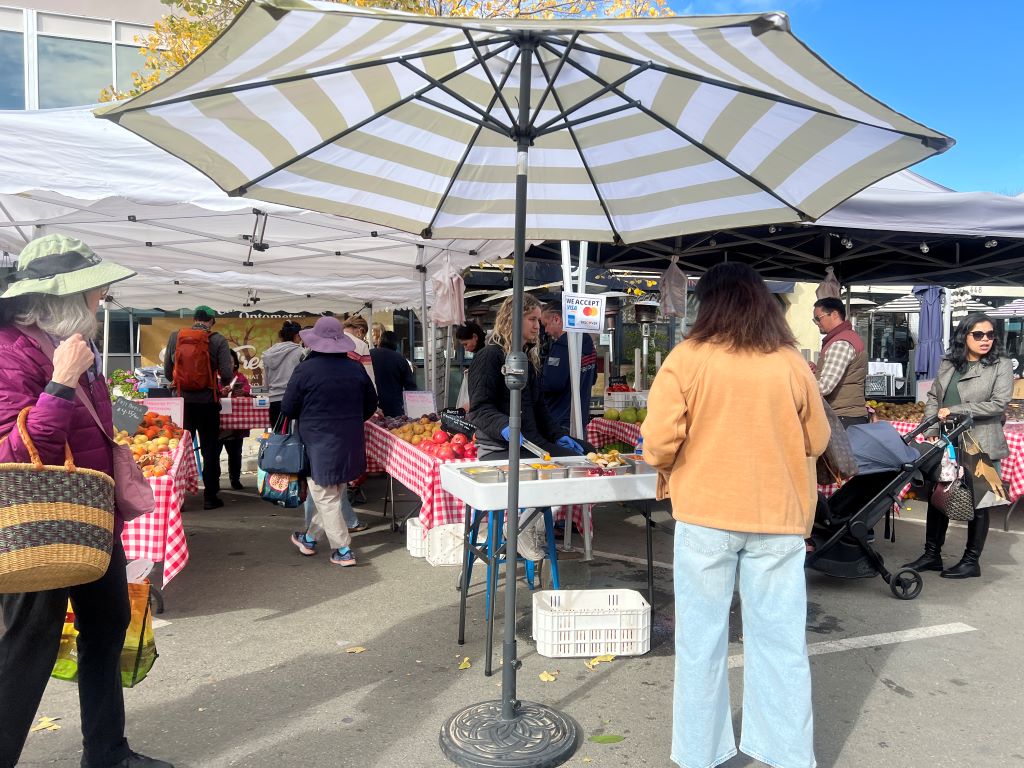
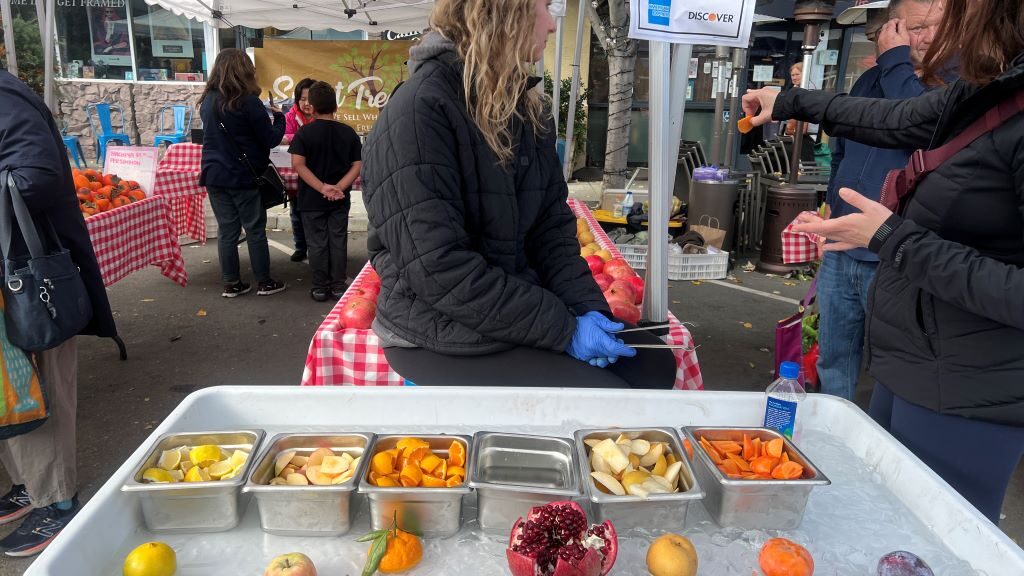
During my recent visit to the Farmers’ Market at the California Avenue, I met a unique and captivating fruit display by Sweet Tree Farms.
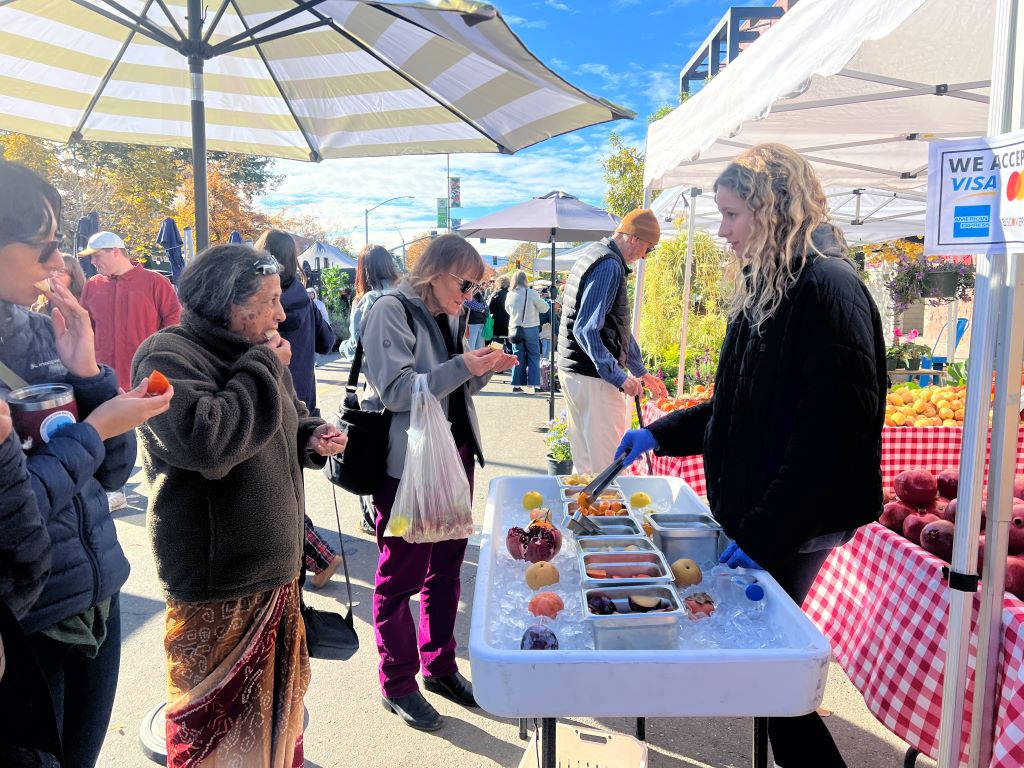
They presented six different fruits (lemon, apple, tangerine, pomegranate, pear, and orange) peeled, chopped, and neatly arranged in clean containers atop a bed of ice. Each container was paired with its whole fruit counterpart, visually comparing between the raw and prepared states of each fruit.
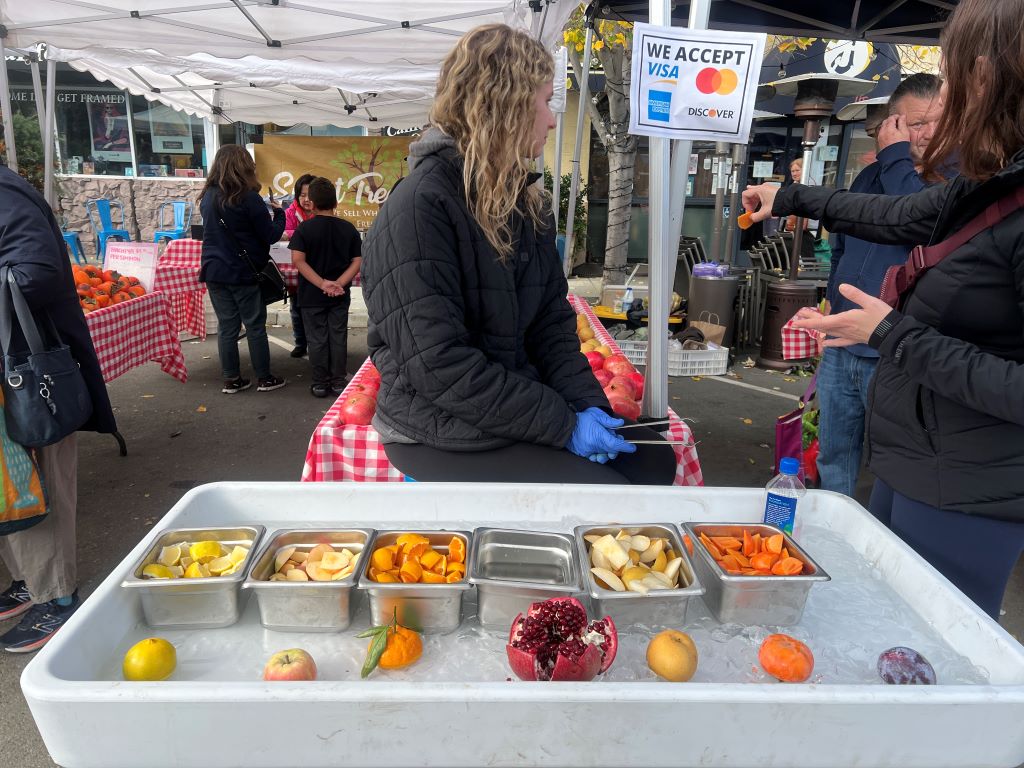
This creative presentation not only demonstrates the freshness of the fruits but also allows shoppers to imagine these fruits as part of their meals. It was shown that neatly organized and visually clear presentations increased consumers’ willingness to buy, at least, for some products.

***

Reference

Deng, X., & Srinivasan, R. (2013). When do transparent packages increase (or decrease) food consumption?Journal of Marketing77(4), 104-117.

Transparent packages are pervasive in food consumption environments. Yet prior research has not systematically examined whether and how transparent packaging affects food consumption. The authors propose that transparent packaging has two opposing effects on food consumption: it enhances food salience, which increases consumption (salience effect), and it facilitates consumption monitoring, which decreases consumption (monitoring effect). They argue that the net effect of transparent packaging on food consumption is moderated by food characteristics (e.g., unit size, appearance). For small, visually attractive foods, the monitoring effect is low, so the salience effect dominates, and people eat more from a transparent package than from an opaque package. For large foods, the monitoring effect dominates the salience effect, decreasing consumption. For vegetables, which are primarily consumed for their health benefits, consumption monitoring is not activated, so the salience effect dominates, which ironically decreases consumption. The authors’ findings suggest that marketers should offer small foods in transparent packages and large foods and vegetables in opaque packages to increase postpurchase consumption (and sales).

Less is better for flower?

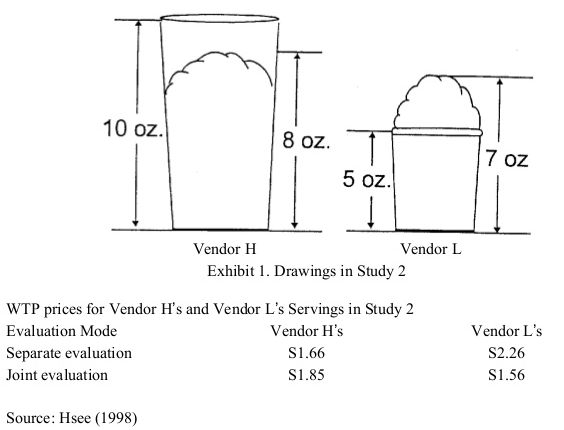
Less is often better. Chris Hsee demonstrated in his experiment that an overfilled ice cream serving with 7 oz of ice cream was valued more than an underfilled serving with 8 oz of ice cream. However, participants indicated greater willingness to pay for an underfilled ice cream than an overfilled one ($1.85 vs. $1.56). This is because, according to him, when participants determined the value of each option alone (i.e., separate evaluation), they focused on an easy-to-evaluate attribute (whether an ice cream is overfilled or underfilled) and failed to consider a hard-to-evaluate attribute (the amount of ice cream). However when indicating their willingness to pay together (i.e., joint evaluation), they considered the hard-to-evaluate attribute important. Note that a hard-to-evaluate attribute is an attribute that “people do not know whether a given value on that attribute is good or bad.”

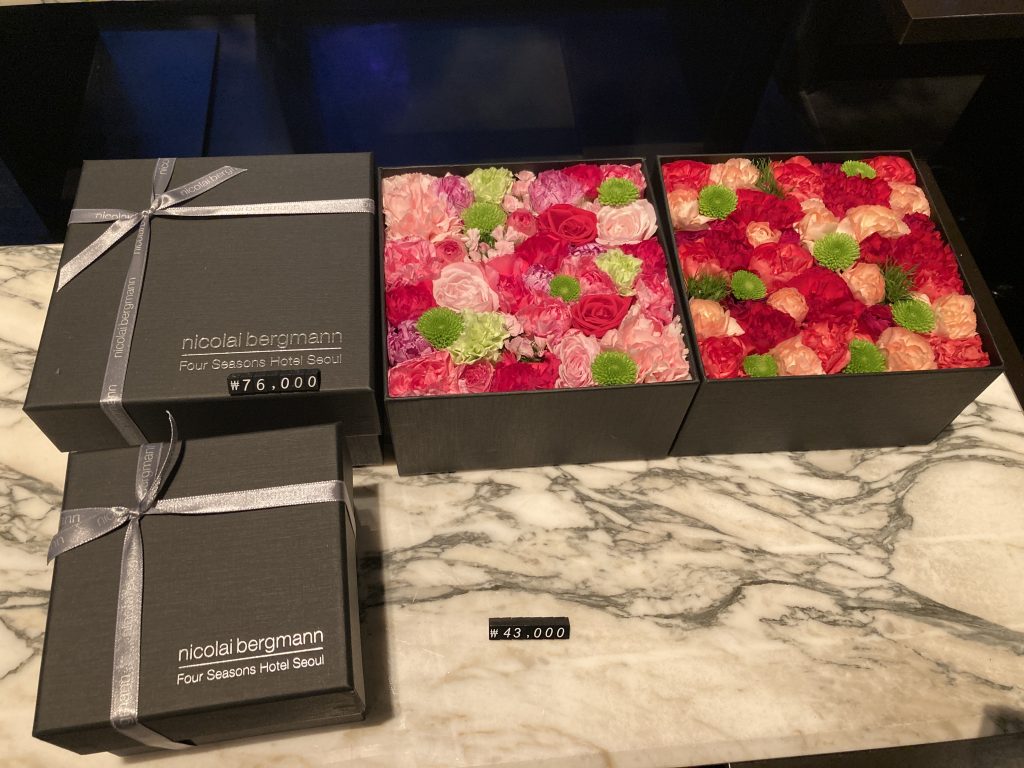
I had a similar experience at the Nicolai Bergmann, a flower shop located in Seoul, Korea. A preserved, overfilled flower attracted my attention when I entered the store. However, I found another flower next to it and it was in a square box. Although the overfilled flower attracted me first, I chose the boxed one for several reasons. The primary reason was that when comparing these two flowers side-by-side, I considered their hard-to-evaluate attribute (the amount of flower) seriously. I expect many other visitors may reach the same conclusion.

Hsee, C. K. (1998). Less is better: When low‐value options are valued more highly than high‐value options. Journal of Behavioral Decision Making11(2), 107-121.

This research demonstrates a less-is-better effect in three contexts: (1) a person giving a $45 scarf as a gift was perceived to be more generous than one giving a $55 coat; (2) an overfilled ice cream serving with 7 oz of ice cream was valued more than an underfilled serving with 8 oz of ice cream; (3) a dinnerware set with 24 intact pieces was judged more favourably than one with 31 intact pieces (including the same 24) plus a few broken ones. This less-is-better effect occurred only when the options were evaluated separately, and reversed itself when the options were juxtaposed. These results are explained in terms of the evaluability hypothesis, which states that separate evaluations of objects are often infuenced by attributes which are easy to evaluate rather than by those which are important.

How many items should be displayed in a store?

When we are curious about value of an unknown object, we often consider how many people surround it. If it is alone, we believe it is expensive. If it is surrounded by many others, we believe it is cheap. This is because, according to O’Guinn’s et al. (2015), as the social density of a given space increases, “inference of the subjective social class and income of people in that space” fall. Although we like different degrees of crowdedness (D&Department in Tokyo) and even view the same degree of crowdedness differently (Kronen Vanlose in Copenhagen), crowdedness decreases the value of a product.

O’Guinn, T. C., Tanner, R. J., & Maeng, A. (2015). Turning to space: Social density, social class, and the value of things in stores. Journal of Consumer Research, 42(2), 196-213.

This article is about social space and material objects for sale within that space. We draw primarily on Goffman’s (1971) concepts of use space and possession territories to predict that as the social density of a given space increases, inferences of the subjective social class and income of people in that space fall. Eight studies confirm that this is indeed the case, with the result holding even for stick figures, thus controlling for typical visual indicators of social class such as clothing or jewelry. Furthermore, these social class inferences mediate a relationship between social density and product valuation, with individuals assessing both higher prices and a greater willingness to pay for products presented in less crowded contexts. This effect of inferred class on product valuation is explained by status-motivated individuals’ desire to associate with higher-status people. To the best of our knowledge, this research is the first to reveal the link between social density, status inferences, and object valuations. As such, it makes a novel contribution to what has come to be known in sociology as the topological turn: a renewed focus on social space.

Then, could we apply the same logic to stores where products are surrounded by other products? In other words, does “product crowdedness” decrease product value as well? This is an important question as stores display items in different ways.

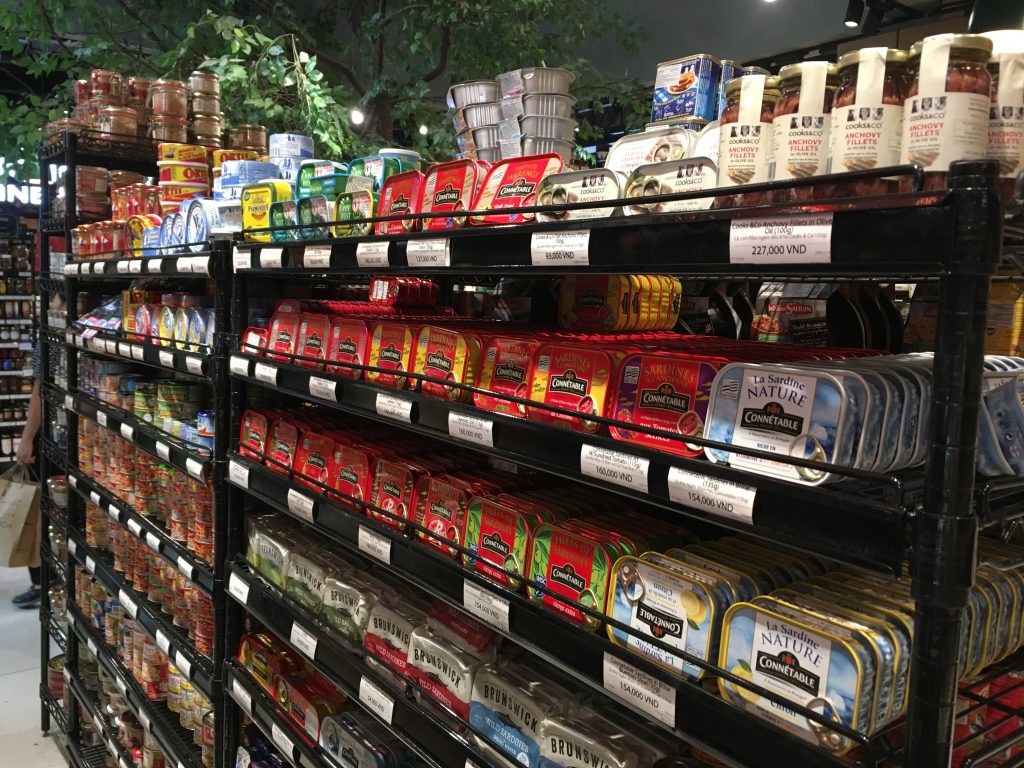
Some stores display various items with a lot of stocks. For instance, at Annam Gourmet, Ho Chi Minh, only a few cans of sea food are on the shelf space with multiple stocks.

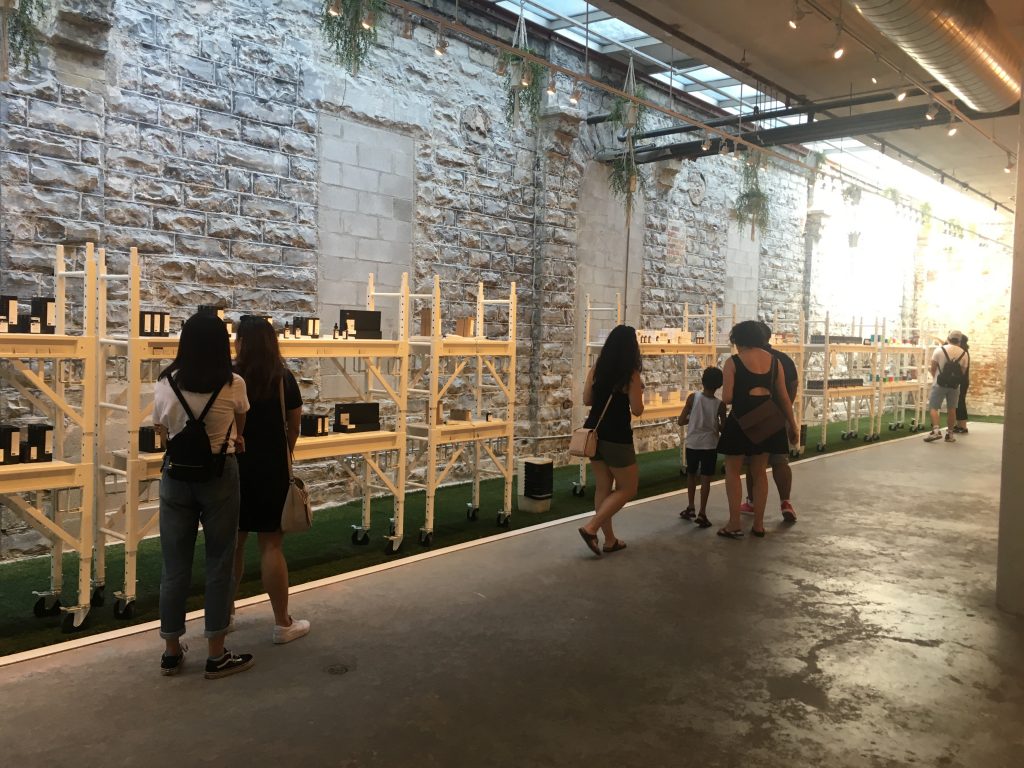
Other stores display only few items with few stocks. For instance, Decium, a Canadian cosmetic company introduces a few items without showing their stocks.  

Two contrasting examples show that stocks determine the perceived value of products. Designers and marketers should decrease the number of products displayed in the store to increase their perceived value. There is a 8-minute video about an inside look at Decium to see how the company has managed to find success in the highly competitive, the multi-billion-dollar world of skin care.