We often write down something on the surface. For instance, a window says “this is a window” or a pedestrian crossing says “Look Right.” However, written, verbal information is easy to be ignored. Compared to verbal information, visual information attracts attention better.
When I visited the design department at the University of Sao Paulo, one of the best universities in Brazil, I found a clever and clear, visual information in a classroom. The wide classroom has four lines of bulbs on the ceiling from the front row to the back end. Although there are four bulb buttons on the wall, the way buttons are placed does not align with the way bulbs are on the ceiling. Instead of writing down “the first row, … the last row,” they match buttons and bulbs through color.


***
Reference
Lurie, N. H., & Mason, C. H. (2007). Visual Representation: Implications for Decision Making. Journal of Marketing, 71(1), 160–177.
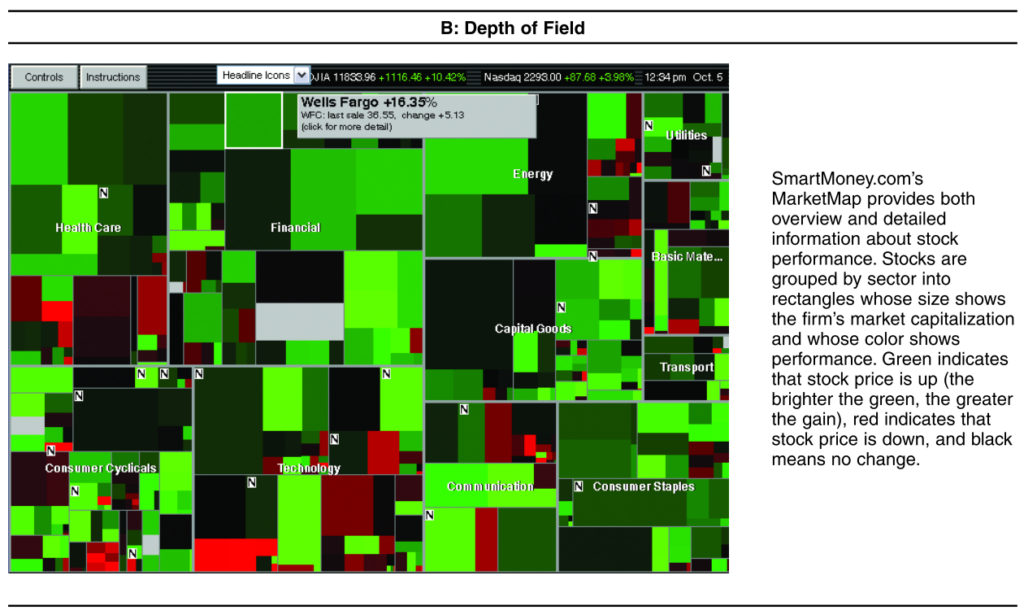
A large number of visualization tools have been created to help decision makers understand increasingly rich databases of product, customer, sales force, and other types of marketing information. This article presents a framework for thinking about how visual representations are likely to affect the decision processes or tasks that marketing managers and consumers commonly face, particularly those that involve the analysis or synthesis of substantial amounts of data. From this framework, the authors derive a set of testable propositions that serve as an agenda for further research. Although visual representations are likely to improve marketing manager efficiency, offer new insights, and increase customer satisfaction and loyalty, they may also bias decisions by focusing attention on a limited set of alternatives, increasing the salience and evaluability of less diagnostic information, and encouraging inaccurate comparisons. Given this, marketing managers are advised to subject insights from visual representations to more formal analysis.

